Dashboard Overview
The Dashboard is your command center for monitoring chatbot performance, tracking customer interactions, and quickly accessing all plugin settings. Here's everything you need to know.
Accessing the Dashboard
To access the Dashboard, navigate to AI Chatbot → Dashboard in your WordPress admin menu. This is also the default landing page when you click on the "AI Chatbot" menu item.
Key Performance Metrics
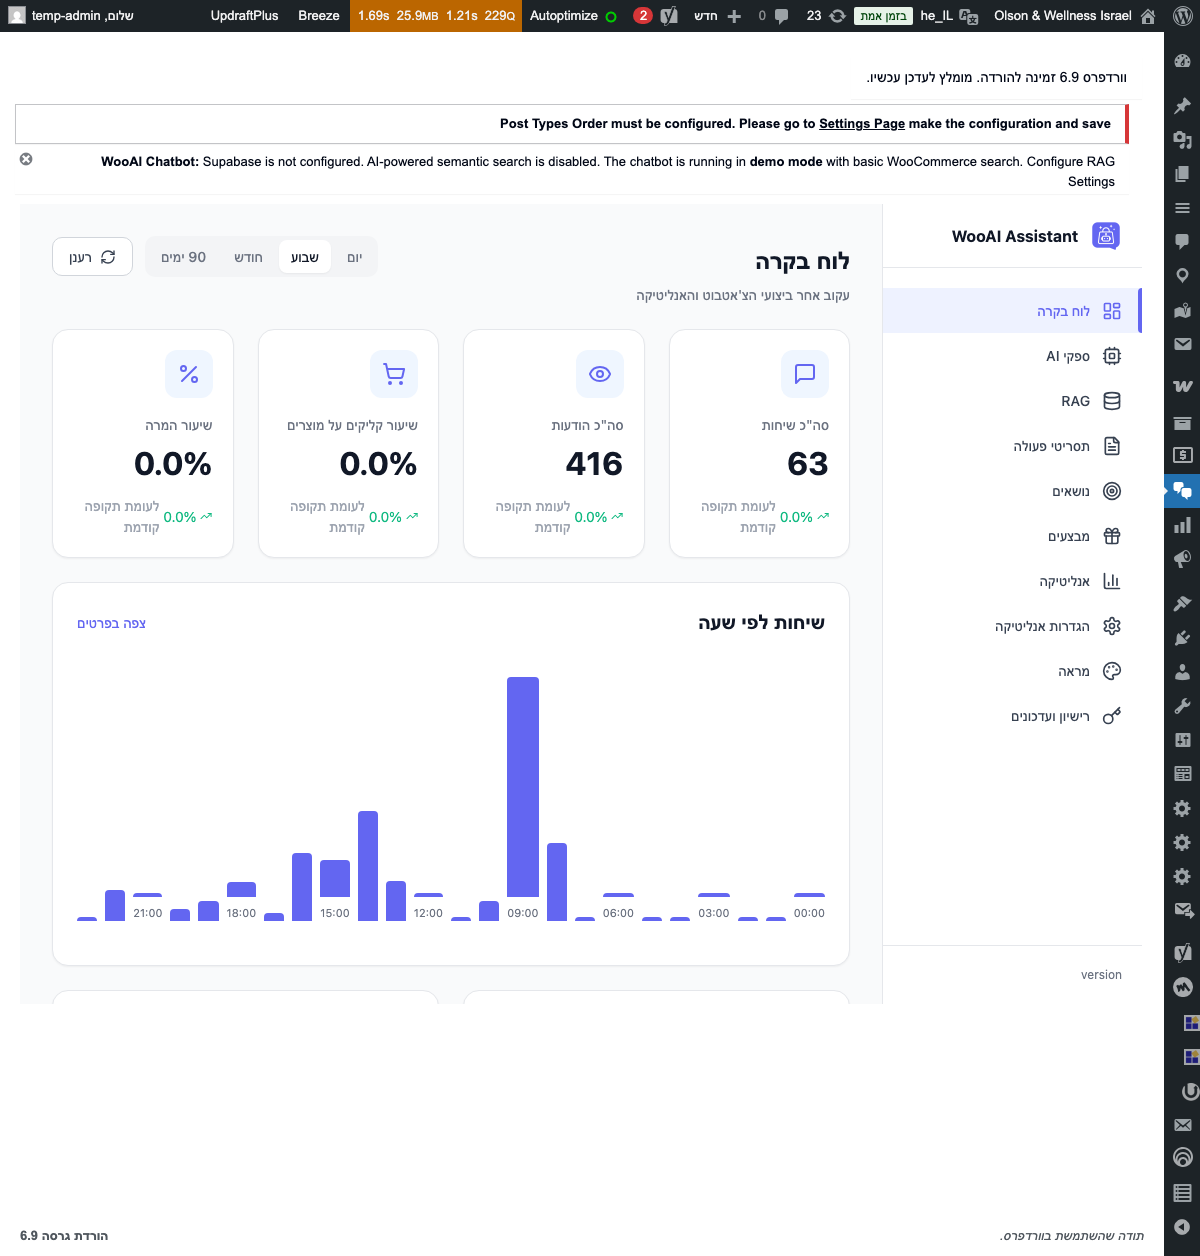
The Dashboard displays four key metrics at a glance, helping you understand how customers are interacting with your chatbot:
Understanding the Metrics
- Total Conversations - The number of unique chat sessions started by customers
- Total Messages - All messages exchanged between customers and the AI assistant
- Product Click Rate - Percentage of conversations where customers clicked on product recommendations
- Conversion Rate - Percentage of chat conversations that resulted in a purchase
Activity Chart
Below the KPI cards, you'll find an activity chart showing conversation volume over time. This helps you identify peak hours and days when customers are most active.
Use the time filter (7 days, 30 days, 90 days) to analyze trends over different periods. This helps identify seasonal patterns in customer engagement.
Navigation Menu
The right sidebar provides quick access to all plugin sections. Here's what each menu item does:
System Notifications
The Dashboard may display important notifications at the top of the page. These include:
- Configuration warnings - When required settings are missing (e.g., no AI provider configured)
- Update notifications - When a new plugin version is available
- License alerts - When your license is about to expire or needs attention
If you see a notice about "Demo Mode", it means the RAG system (semantic search) is not configured. The chatbot will still work but will use basic keyword search instead of intelligent semantic matching.